# Generate random data
n <- 50; p <- 20
x <- abs(rmatrix(n, p, rnorm, mean=4, sd=1))
x[1:10, seq(1, 10, 2)] <- x[1:10, seq(1, 10, 2)] + 3
x[11:20, seq(2, 10, 2)] <- x[11:20, seq(2, 10, 2)] + 2
rownames(x) <- paste("ROW", 1:n)
colnames(x) <- paste("COL", 1:p)
## Scaling
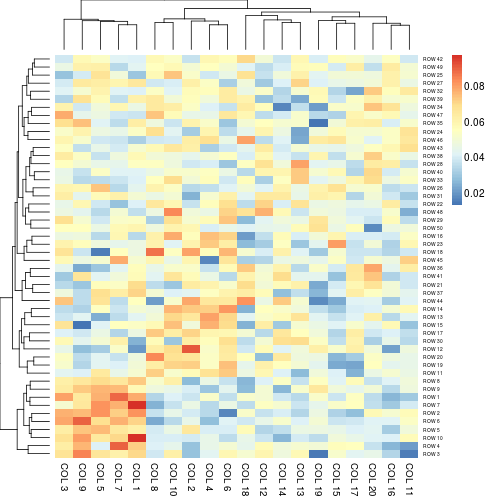
aheatmap(x, scale = "row")

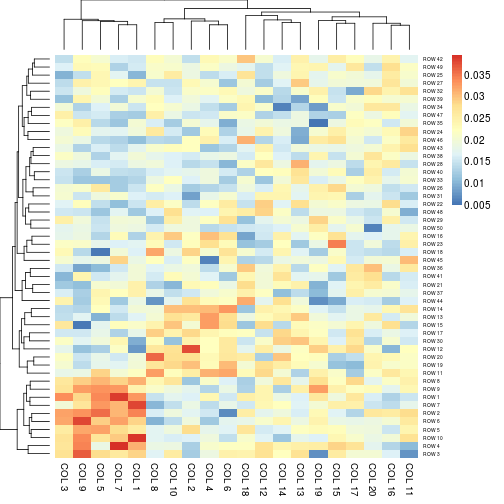
aheatmap(x, scale = "col") # partially matched to 'column'

aheatmap(x, scale = "r1") # each row sum up to 1
aheatmap(x, scale = "c1") # each colum sum up to 1
## Heatmap colors
aheatmap(x, color = colorRampPalette(c("navy", "white", "firebrick3"))(50))

# color specification as an integer: use R basic colors
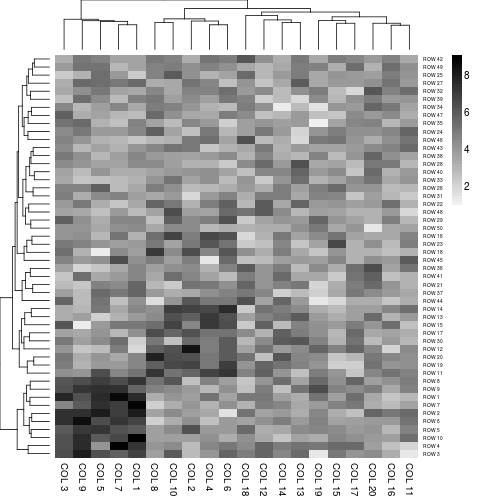
aheatmap(x, color = 1L)
# color specification as a negative integer: use reverse basic palette
aheatmap(x, color = -1L)

# color specification as a numeric: use HCL color
aheatmap(x, color = 1)

# do not cluster the rows
aheatmap(x, Rowv = NA)

# no heatmap legend
aheatmap(x, legend = FALSE)

# cell and font size
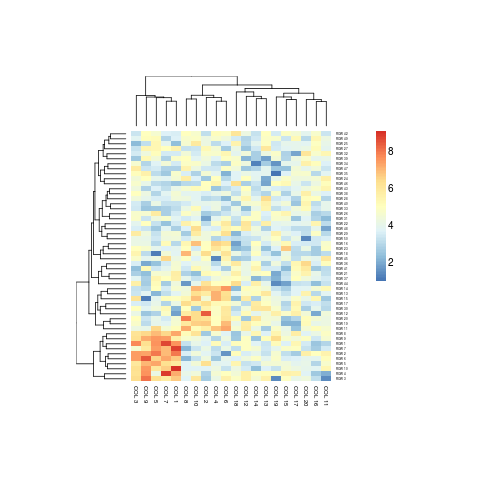
aheatmap(x, cellwidth = 10, cellheight = 5)
# directly write into a file
aheatmap(x, cellwidth = 15, cellheight = 12, fontsize = 8, filename = "aheatmap.pdf")
unlink('aheatmap.pdf')
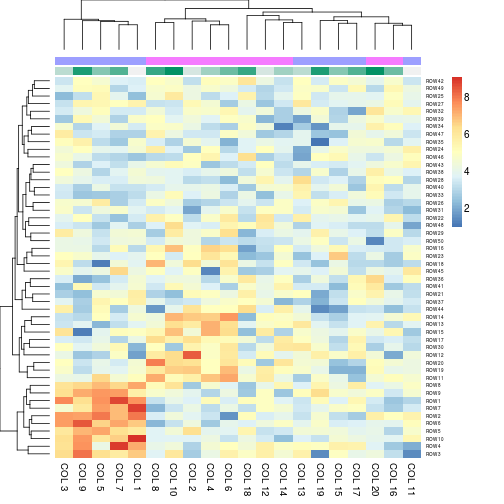
# Generate column annotations
annotation = data.frame(Var1 = factor(1:p %% 2 == 0, labels = c("Class1", "Class2")), Var2 = 1:10)
aheatmap(x, annCol = annotation)

aheatmap(x, annCol = annotation, annLegend = FALSE)
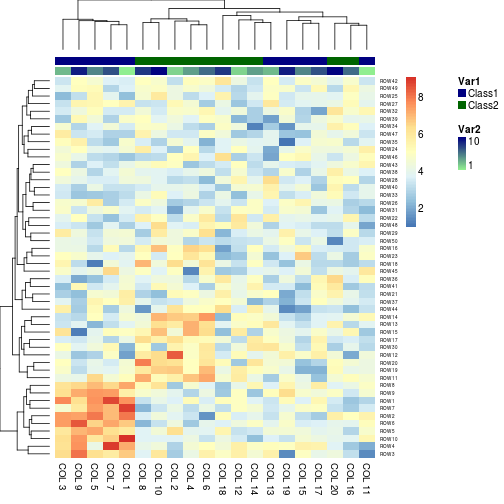
# Specify colors
Var1 = c("navy", "darkgreen")
names(Var1) = c("Class1", "Class2")
Var2 = c("lightgreen", "navy")
ann_colors = list(Var1 = Var1, Var2 = Var2)
aheatmap(x, annCol = annotation, annColors = ann_colors)
# Specifying clustering from distance matrix
drows = dist(x, method = "minkowski")
dcols = dist(t(x), method = "minkowski")
aheatmap(x, Rowv = drows, Colv = dcols)
